Welcome to my world, where my knack for business success centered around building scalable data and
business intelligence solutions [business aligned analysis, dashboards, automated reports] to guide
business decisions, not assumptions, integrating business domain knowledge, automation, and AI.
Effectively communicate insights, and recommendations to cross-functional teams stakeholders, and
executives, by telling data stories.
ABOUT ME
DATA & BI ANALYST
Hello! I'm Olasunkanmi, and I'm excited to have you read about me, my fascination with data began in my undergraduate years when I became curious about how my mom’s business was performing. She didn’t keep records, and all expenses were covered directly from the business earnings. By tracking the cost of goods, calculating total revenue after sales, and determining her actual profit, I helped structure the business better. This not only gave us insight into how much we could live on but also allowed us to reinvest a portion of the profit to expand the business.
As a seasoned Data and Business Intelligence Analyst with four years of experience in the iGaming, Financial institution, and SaaS domains, my passion for data analysis and visualization has allowed me to contribute meaningfully through building data and BI solutions and providing insights that drive revenue growth, performance, user acquisition, campaign success, user experience optimization, operation efficiency and identification of new opportunities for SaaS, iGaming, sports betting, and casino games offerings. My dedication to making data accessible and actionable has been fueled by a fascination with how information can shape business strategies and informed decision-making.
My expertise spans industry-leading tools such as Excel (Power Query, Power Pivot), Power BI (data modeling, DAX, dashboard, and report building, managing data security and providing access), SQL (writing optimized queries, managing databases), and Azure Cloud Warehousing (Azure data factory, Azure SQL databases). Furthermore, I am keen on continuous learning and passionate about taking on new challenges independently or collaboratively.
My experience collaborating with cross-functional teams and enhancing communication between technical and non-technical stakeholders has proven valuable in building data solutions and achieving common goals.
With my attention to detail, presenting insights in reports, and interactive dashboards with compelling visuals, and drive for business success. I'm always looking for opportunities to grow and contribute in the evolving world of data analytics and in businesses or workplaces where challenges translate to career growth.
EXPERIENCE
◉ Rightstake, February 2024 - Present
• Data & BI Analyst - Commercial | Gaming
In my role as a Data & BI Analyst, I have spearheaded initiatives that optimized business processes and improved key performance metrics. I am responsible for leveraging data to drive strategic decisions and optimize performance—focusing on revenue growth, ROI on commercial spending, operational efficiency, and campaign success—across sportsbook, casino, and live casino activities.
My responsibilities include developing KPIs and BI solutions, managing and conducting in-depth and ad hoc data analysis to provide insights and recommendations to the commercial, marketing, product, and operations teams, and ensuring that data-driven insights inform stakeholders' and executives' decision-making and drive overall business performance. I also manage commercial projects involving in-house creatives, the ads team, and influencers.
◉ Nugi Technologies Limited, February 2022 - April 2024
• Product Data Analyst - SaaS
I collaborate closely with cross-functional teams—Engineering, Product Management, Marketing & Sales, and Customer Support—to identify performance bottlenecks and optimize application response times by analyzing log files and customer journey data, extracting valuable insights, and sharing actionable recommendations to help teams achieve significant improvements in efficiency, customer satisfaction, user acquisition, and retention rates.
I wrote optimized SQL and DAX queries for data extraction, created insightful dashboards, and visualized key performance indicators such as response times, app feature adoption, frequency of app visits, top-performing marketing channels, and resource utilization, providing stakeholders with reports on how these impact business growth and product acceptance.
◉ National Centre for Remote Sensing Agency
June 2019 - July 2020
• Data Analyst Intern
I Facilitated simplified large-scale data collection for public health and environmental projects by remodeling questionnaires in X-form format with an Open Data Kit.
Streamlined data processing time by 50% by implementing data validation, ensuring accuracy, and improving the quality of data collected by prioritizing standardization, then utilizing Power Query to automate data cleaning and transformation for routine data quality assessment.
Provided data-related support for the implementation of coordinated public health and environmental projects.
◉ The Rahman Oyeneyin Foundation, May 2023 - Present
• Program / ICT Officer - Volunteer
Oversaw the development of various programs aimed at assisting individuals in achieving their ambitions, and successfully managed projects from conception to completion, ensuring alignment with the foundation's goals.
Effectively managed project budgets, ensuring optimal utilization of resources and cost-effectiveness.
Established and managed the foundation's ICT platforms, enhancing digital presence, creating, and maintaining a dynamic social media presence, expanding the foundation's reach and engagement.
Support the facilitation of collaborating with the Ondo State Health Board to provide free health care coverage for all the recipients of free educational empowerment program within the foundation.
Conducted impact assessments of programs, providing valuable insights for continuous improvement, and received positive feedback from programs beneficiaries, reflecting the foundation's positive influence.
Implemented cost-effective measures, reducing ICT-related expenses by 50%.
EDUCATION
Olusegun Agagu University of Sci. & Tech, 2018
Computer Science
Second Class Upper Division honors
SKILLS
Data Analysis & Insights
Data modeling
Data Visualization & Dashboard - Power BI
Execellence Design thinking thought process
Optimized SQL Queries
Azure Cloud Warehousing [Azure Data Factory & Azure SQL Database]
GIT / Jira
CRM Tools: Mixpanel, Google Analytics, Post Aff. Pro
Python for ETL, Visualizations
Collaboration & Clearly communication insights
Creative Problem Solving
Clickatell empowers businesses to connect with customers via SMS, WhatsApp, and other channels, enabling seamless communication, engagement, and transactions. As a BI and Data Visualization Specialist, I conducted a comprehensive business performance analysis and developed a BI solution to drive actionable insights for our clients.
Using SQL, I analyzed top-performing clients in terms of interactions, client engagement, end-user demographics, activity ranking, transaction analysis, and interaction success rates. Reports and actionable recommendations were delivered to guide stakeholders in resource allocation for marketing and commercial spending, optimizing acquisition costs, and improving client satisfaction and retention.
I also developed an interactive dashboard to help clients track interaction success and failure rates (successful, pending, and failed transactions) while gaining deeper insights into their end users.
Explore my analysis and dashboard to see my design thinking process, functional dashboard development, and creative approaches to solving business problems through clear data-driven communication.
Customer Churn Analysis should be a regular analysis project with a product and service rendering company, facts show that it costs businesses more to acquire new customers than to maintain existing ones, and knowing this, a replica real-world problem sparked my interest in analyzing the dataset provided by Maven Analytics Telecomm Customer Churn.
I use SQL to analyze customer churn in the telecommunications industry! Through data cleaning and analysis, I was able to identify key factors contributing to churn and develop recommendations for retaining high-value customers.
What insights can be derived from the 2024 Customer Service Week (CSW) free bet campaign on sports activities to optimize future campaigns?
I analyzed sports betting activities including YTD aggregated betting activities before the CSW free bet offer was given, betting activities during and one week after the campaign week, and compared players' betting patterns with real money and free bets, GGR trends, and first-time deposit trends related to new users and activation of inactive players.
- Provided insights and recommendations tied to data findings to help marketing teams better align the next few months' marketing campaigns to the company’s goal.
- Mitigate risks such as negative gross gaming revenue.
- Better tailor campaigns to reactivate inactive players, improve user acquisition, and retention, and ROI on commercial spending.
- Built a high-level interactive dashboard to help Executives, and stakeholders monitor campaign KPIs.
5 Free spins costing ₦25 each and a 100% deposit bonus up to ₦10, 000 were offered to 4,726 inactive players when they logged in, it was valid for 3 days.
I analyzed the campaign and extracted insights to shape the campaign strategy for the next few months. I have the campaign results dataset and player betting activities within the three-day free spins and deposit bonus validity period.
I decided to go back to the basics, perform the analysis using Excel as an end-to-end tool, handling the entire analysis life cycle, from importing and loading data through model connection, transforming and modeling data in Power Query, creating relationships between tables in Power Pivot, summarizing insights with Pivot tables and writing DAX functions to compute KPIs, extract intricates insights and outline trends to enhance my analysis and even present my executive report in Excel.
Explore the report and the Excel worksheet of the complete analysis, and enjoy the data storytelling.
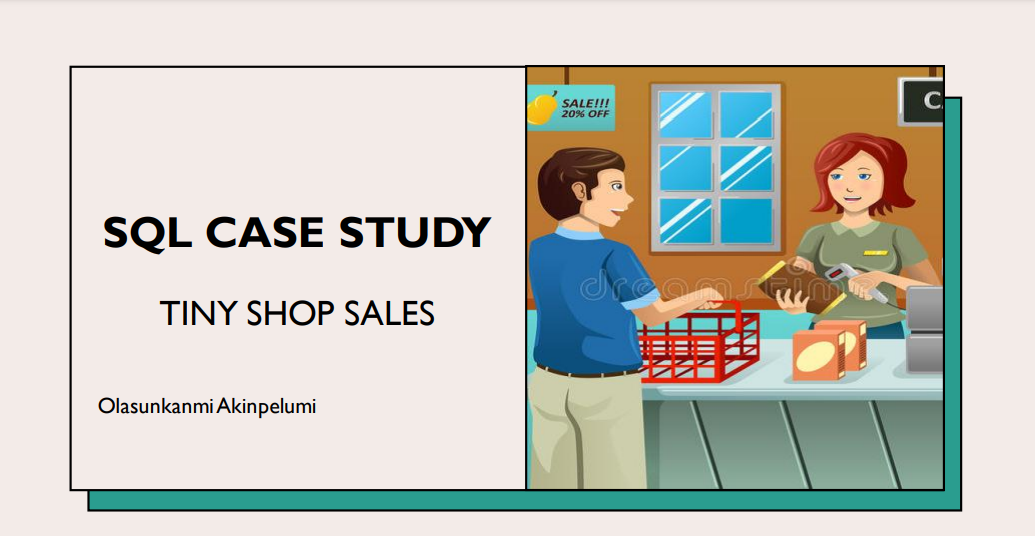
I had fun writing SQL queries to answer all the business questions in the first Data In Motion, LLC SQL Case Study, thanks to Data In Motion, LLC and Kedeisha Bryan for coming up with this fresh idea.
The Case Study comes with a Tiny Shop Sales dataset with several business questions to be answered, participating intensifies my SQL skills, here's my submission put together as a short presentation in PowerPoint.
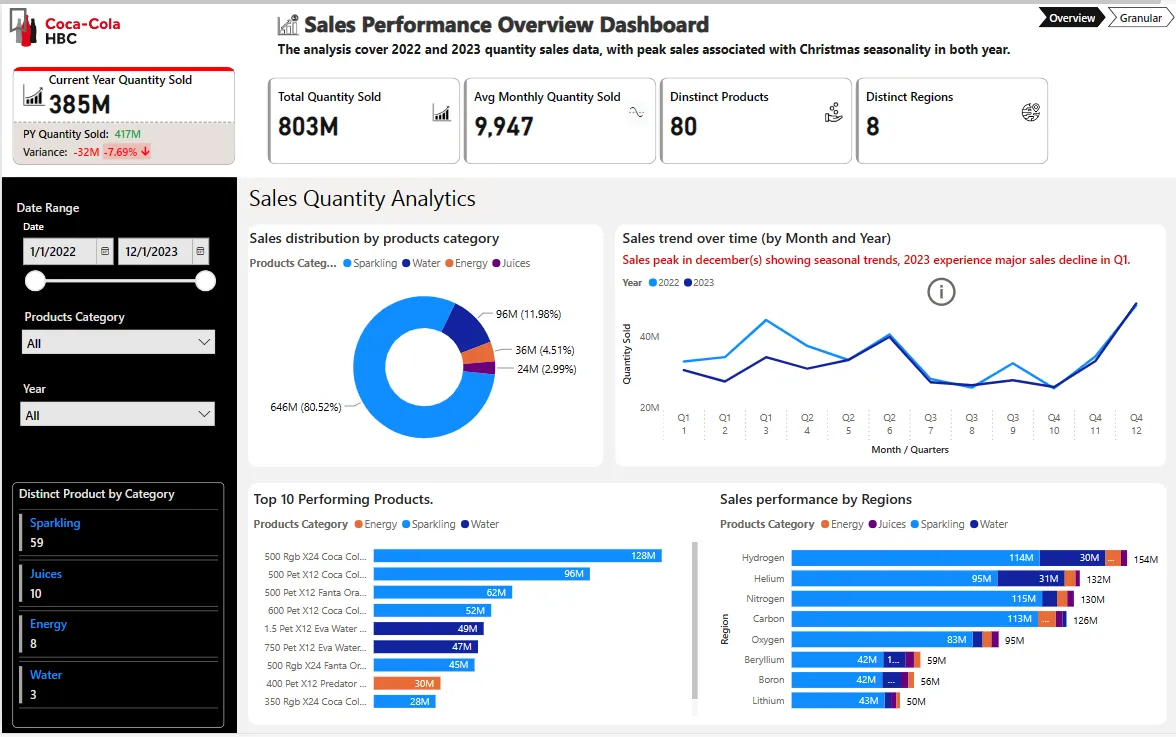
Hey, ever wondered what fuels Coca-Cola's success year after year? Let's dive deep into their sales data to uncover the fizz behind the figures
In this Case Study, I explore the field of Sales Performance Analytics and complete all the tasks as assigned in the Coca-Cola assessment test brief.
I identify patterns and anomalies in sales data, determine the impact of different product categories on overall sales performance, highlight potential areas for sales improvement or market expansion, and provide recommendations in these regards.
I developed an interactive high-level dashboard for a Chat Commerce Executive to track important business metrics and KPIs, which cover successful, failed, and pending interactions and status of transactions completed over those interactions as the major service to render to their clients.
Real-time insights from BI solutions informed Executive decision-making while getting the business performance overview anytime, anywhere.
This dashboard is a comprehensive BI solution designed to deliver real-time insights into inbound and outbound interactions between our clients and their end users. It integrates data on transactions conducted through these interactions and visualizes the distribution of clients and end users across regions and industries.
The dashboard empowers stakeholders and our clients to make informed decisions from insights derived from tracking chat or interaction success and failure rates about successful, pending, and failed transactions, and understand our client based on resource allocation for marketing and commercial spending. It aims to optimize acquisition costs and identify areas for improvement to enhance client satisfaction and improve customer retention rates.
A purpose-driven interactive, and functional dashboard that focuses on providing insights into operational efficiency, employee productivity, cost management, and downtime analysis.
This dashboard brings granular information to the forefront of strategic decision-making for timely and effective people management in a manufacturing and logistics company. It tracks employee shift time utilization week over week, month over month, and quarter over quarter and outlines the time utilization trend and how it influences efficiency.
It helps the business track key performance indicators (KPIs) to optimize resource utilization, employee efficiency, and operational costs while identifying areas for improvement.
The dashboard provides an overview and in-depth analysis of an E-commerce sales performance, tracking metrics such as revenue, quantity of items sold, and profit, while also comparing these with target achievements and year-over-year performance. These insights help businesses identify and understand high-performing areas, products, services, and sales personnel.
Additionally, the real-time insights from this dashboard extend beyond sales department personnel, influencing data-driven decision-making in marketing, budgeting, and strategy. By understanding the dynamics of high-performing areas and products, businesses can apply these insights to improve underperforming products, regions, and sales personnel.
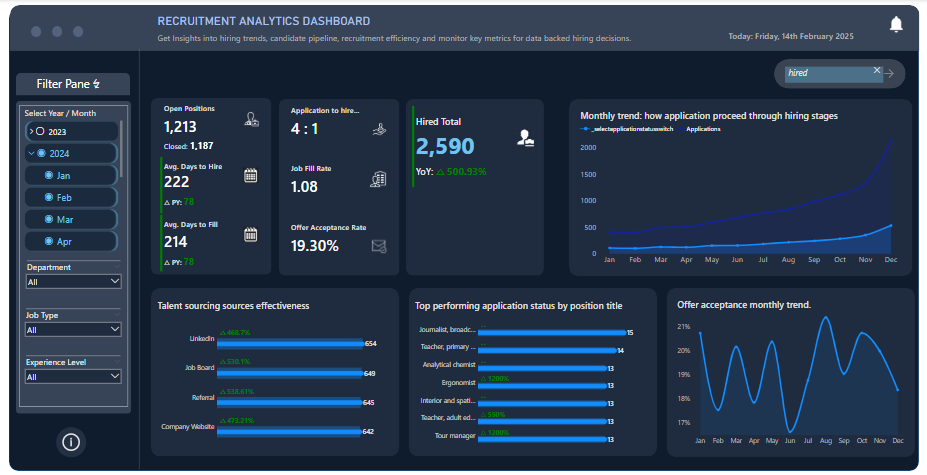
The recruitment dashboard is a robust business intelligence solution designed to facilitate informed decision-making across all hiring stages. It tracks key metrics such as average time to hire, application-to-hire ratio, offer acceptance rate, and open and closed positions. Additionally, it outlines monthly trends by benchmarking total applications against the number of hires, shortlisted candidates, and interviews.
This dashboard also provides an easy-to-use interface for managers to effectively oversee recruiters and track real-time activities within the team. It helps monitor job postings, the number of candidates applying for different roles, and how various application time intervals impact talent success in securing jobs. Ultimately, it serves as a reliable source of truth for generating insights that can improve talent acquisition strategies.
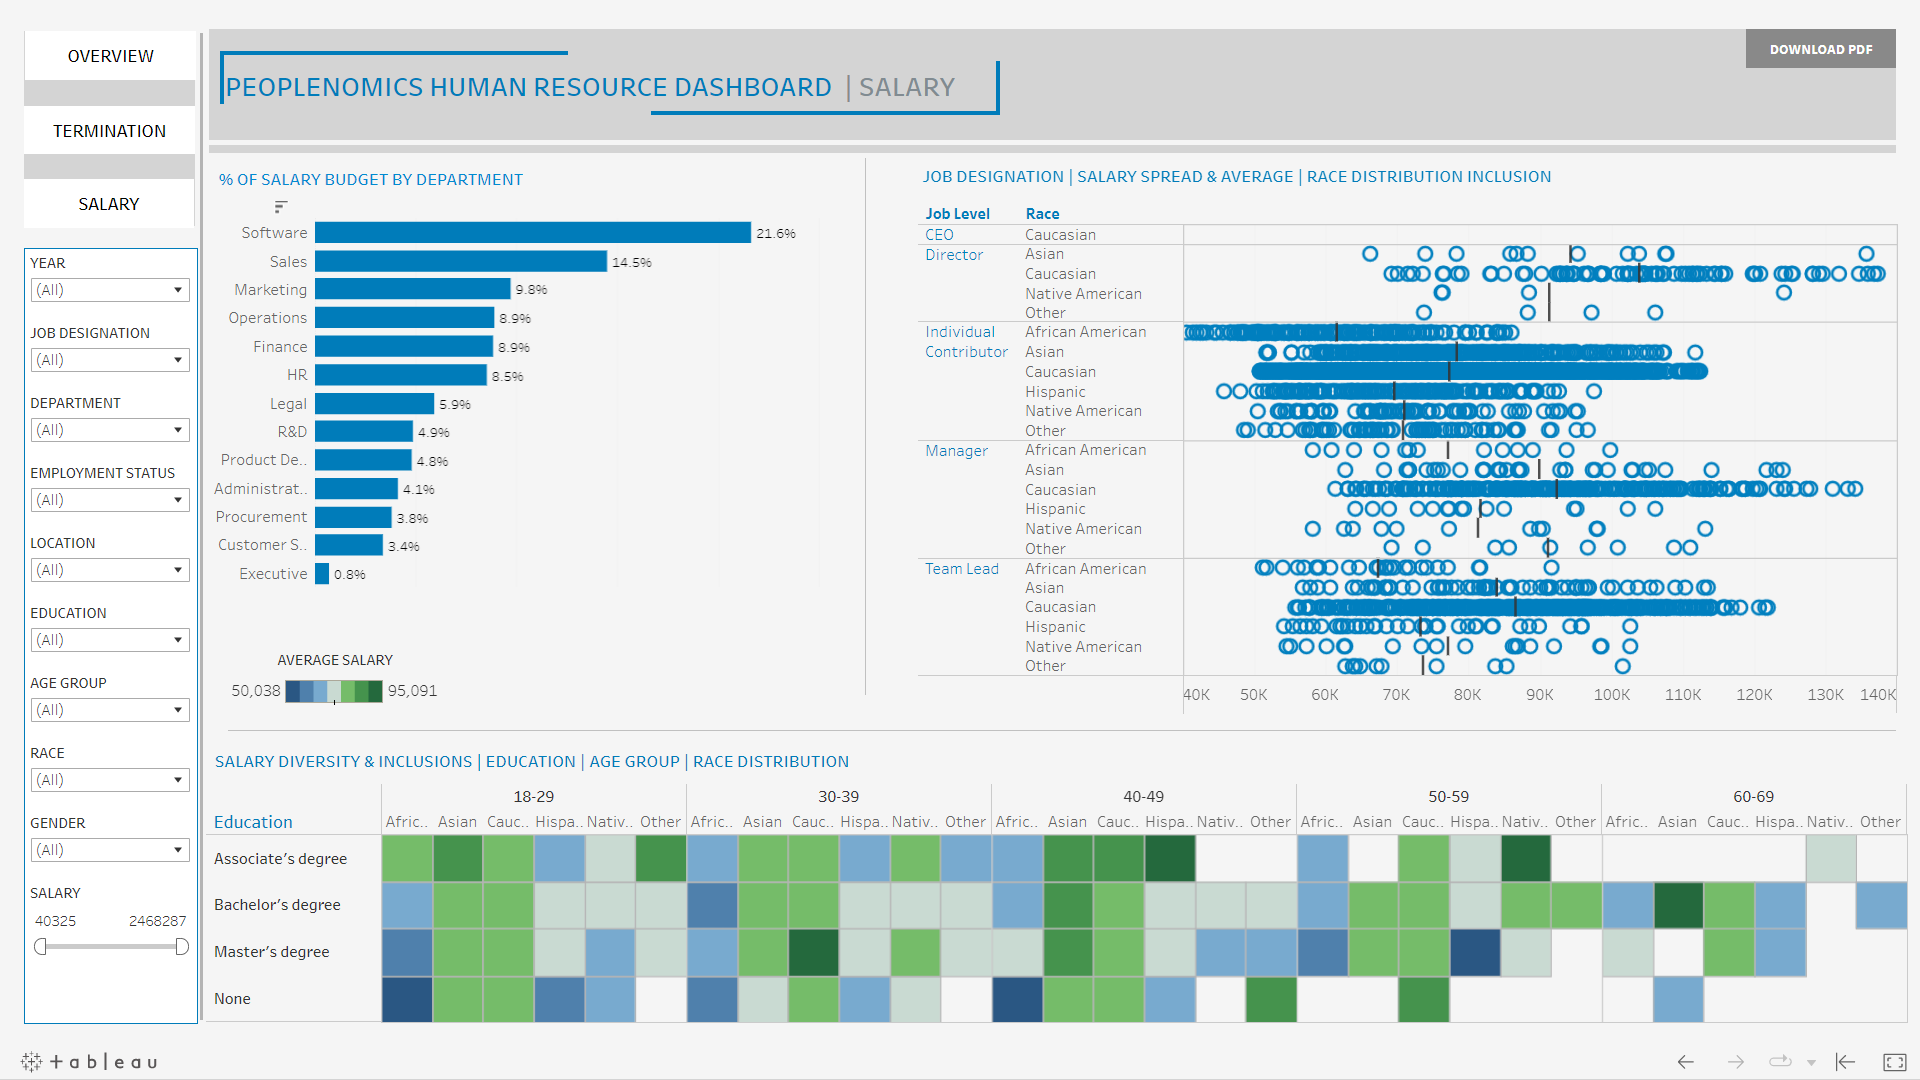
I created the interactive dashboard using Tableau, it serve as a single source of truth for the HR department of a Telecommunication company, data provided by Maven Analytics.
The dashboard had three pages: Employee data overview, Salary overview, and Employee termination report, respectively providing a comprehensive snapshot of the company's workforce, with insights into compensation and benefits data, the dashboard will help HR managers make informed decisions about employee retention.
This is bold and this is strong. This is italic and this is emphasized.
This is superscript text and this is subscript text.
This is underlined and this is code: for (;;) { ... }. Finally, this is a link.
Heading Level 2
Heading Level 3
Heading Level 4
Heading Level 5
Heading Level 6
Blockquote
Fringilla nisl. Donec accumsan interdum nisi, quis tincidunt felis sagittis eget tempus euismod. Vestibulum ante ipsum primis in faucibus vestibulum. Blandit adipiscing eu felis iaculis volutpat ac adipiscing accumsan faucibus. Vestibulum ante ipsum primis in faucibus lorem ipsum dolor sit amet nullam adipiscing eu felis.
Preformatted
i = 0;

while (!deck.isInOrder()) {
    print 'Iteration ' + i;
    deck.shuffle();
    i++;
}

print 'It took ' + i + ' iterations to sort the deck.';